Our team deployed an app called Life, Death and Poverty on Heroku!
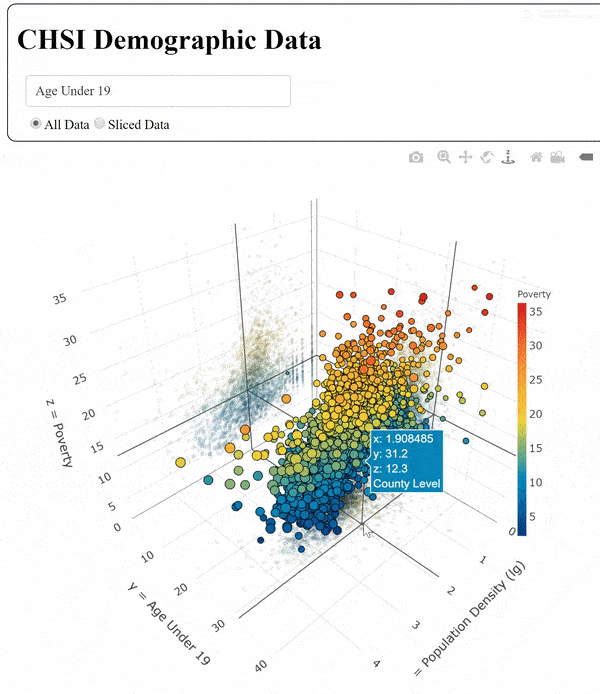
Using plotly dash, we visualize the dataset taken by the Community Health Status Indicators (CHSI) to help understand and increase awareness of how each cause of death affects people across America.
Data Source - Centers for Disease Control and Prevention (CDC) Dataset
Our Teamwork
【Deployment and Dash】by @leehanchung
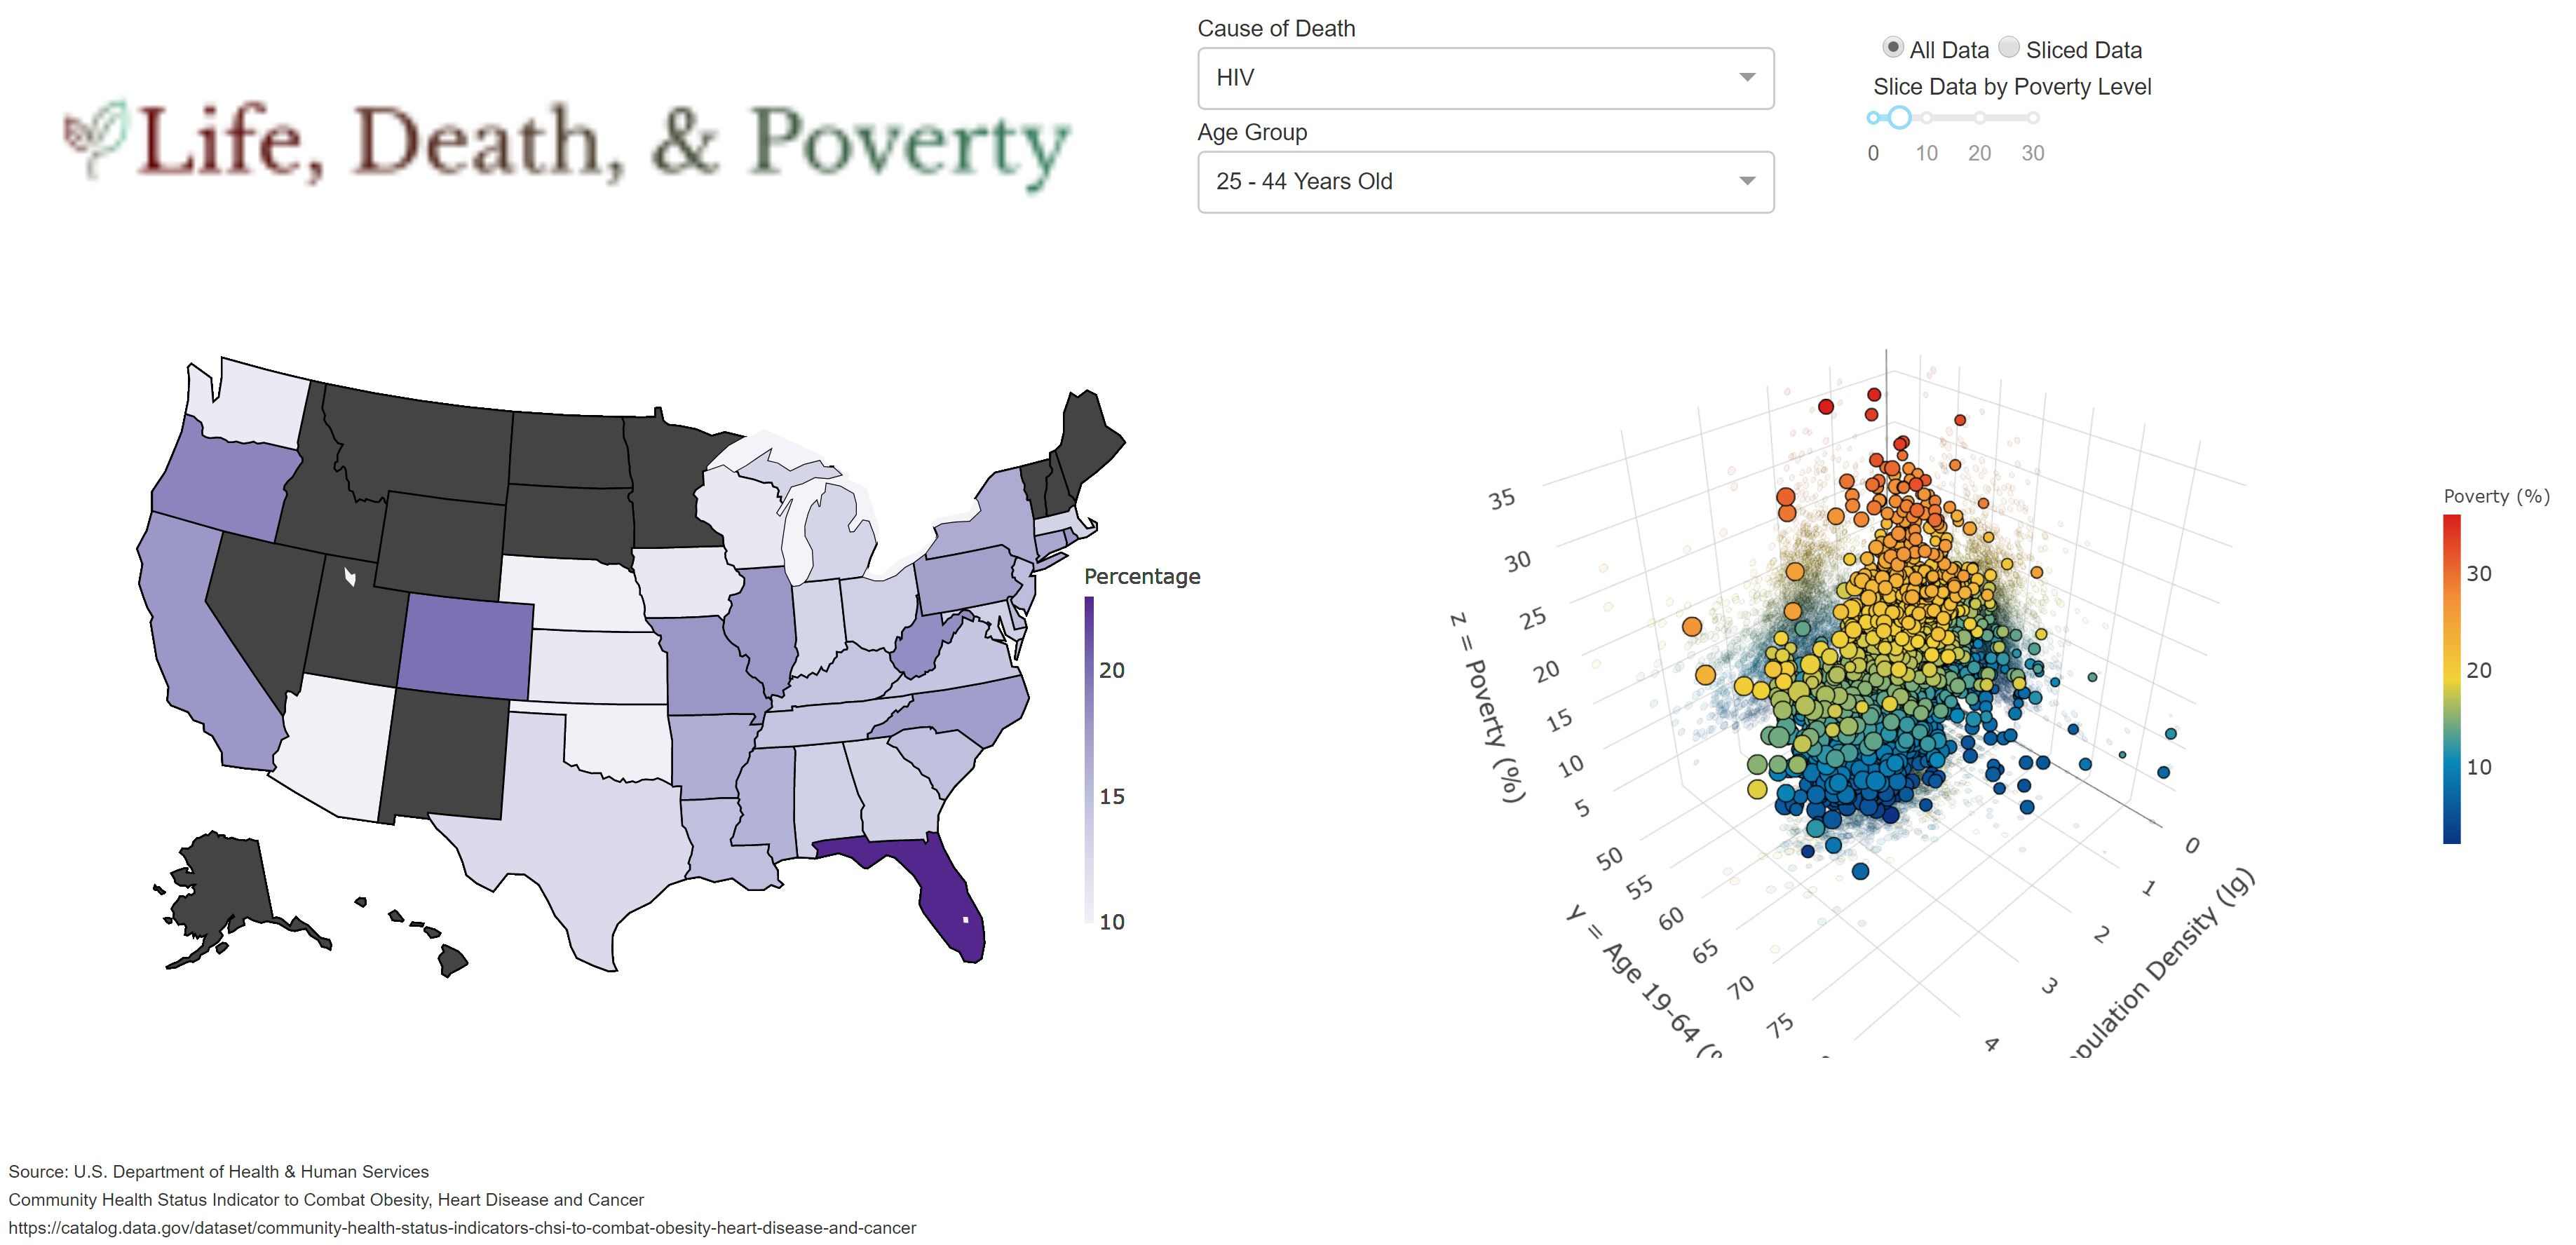
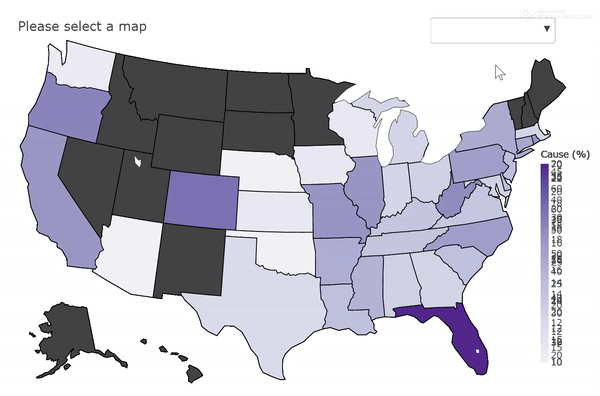
【Plotly Choropleth Map】by @gyhou
【Plotly 3D Scatter】by @nov05